ARCTIC SEA ICE is also decreasing. The primary consequence is a subsequent increase in warming. Bright white ice and snow reflects sunlight and its warming energy back into space. As the mass of white on the northern pole melts, it exposes a dark ocean. Dark surfaces absorb heat rather than reflect it. This reflection of energy is called albedo. The measure of albedo ranges from 0 to 1, with 1 signifying full reflection of incoming energy. As the National Snow and Ice Data Center explains, “A typical ocean albedo is approximately 0.06, while bare sea ice varies from approximately 0.5 to 0.7. This means that the ocean reflects only 6 percent of the incoming solar radiation and absorbs the rest, while sea ice reflects 50 to 70 percent of the incoming energy. The sea ice absorbs less solar energy and keeps the surface cooler.” Sea ice with snow on top of it reflects even more energy and takes longer to melt. This is one of several processes known as climate feedback loops. Human activity causes the Earth to heat up, the warmer temperatures melt Arctic sea ice, the now exposed Arctic ocean warms up the planet further, which then melts more sea ice, and the process continues.
The Arctic sea ice grows during the winter and melts to some extent in the summer. The growth of the sea ice is declining and the melt is getting more extensive. Warming oceans also contribute to the decline in winter sea ice formation. NOAA reports that, “The winter sea ice extent in 2019 narrowly missed surpassing the record low set in 2018, leading to record-breaking warm ocean temperatures in 2019 on the southern shelf. Bottom temperatures on the northern Bering shelf exceeded 4°C for the first time in November 2018.” The figure below shows the decline of sea ice at the point of maximum ice (in black) and minimum ice (in red).

According to the 2014 US National Climate Assessment (NCA), “Nearly all studies to date published in the peer-reviewed literature agree that summer Arctic sea ice extent is rapidly declining, with even greater reductions in ice thickness and volume, and that if heat-trapping gas concentrations continue to rise, an essentially ice-free Arctic ocean will be realized sometime during this century (for example, Stroeve et al. 2012). September 2012 had the lowest levels of Arctic ice in recorded history.” (see the original report for citations of peer-reviewed research) Satellite tracking of Arctic sea ice began in 1979. Below is a time lapse series capturing Arctic sea ice at its minimum level each year (Sept) from 1979 to 2019.
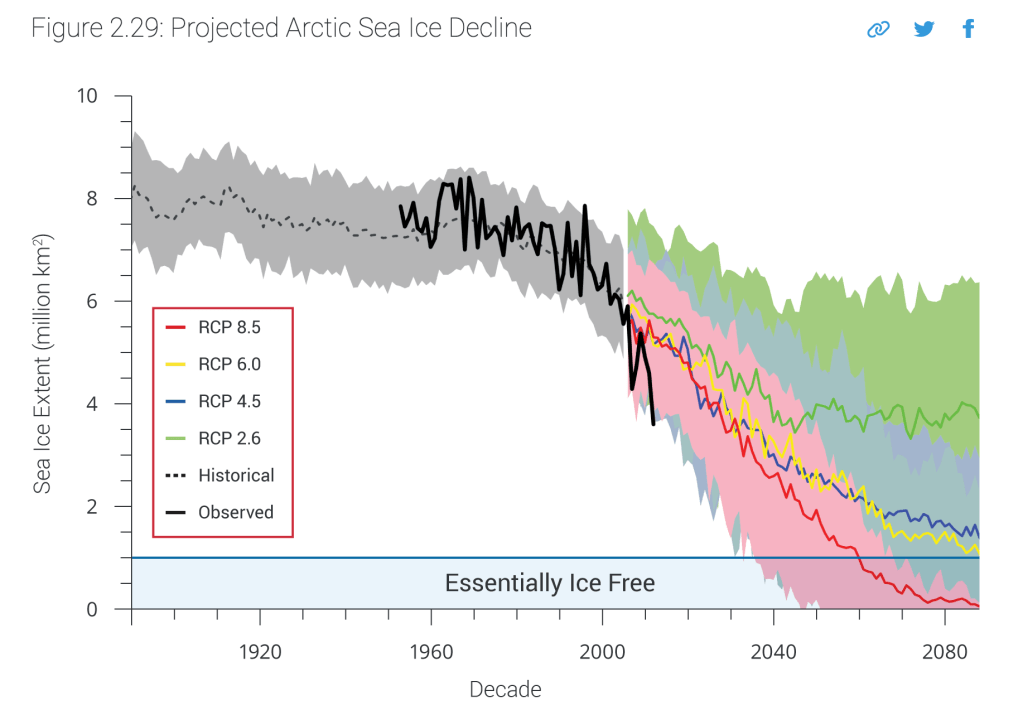
In the figure below from the 2014 NCA, the Arctic could be completely ice-free every September as early as 2060. The different colored lines in the figure below represent different emissions scenarios. The colored bands represent the amount of error in the projections. With rapid and dramatic reductions in emissions, we could avoid ice-free Arctic summers. “RCP” stands for Representative Concentration Pathways. They represent different concentrations of GHG emissions in the atmosphere. They are used to show what would likely occur if we continued as we are (red) or reduced emission under different policies (yellow, blue, and green lines). RCP 2.6 (the green line) is the pathway to keeping warming below 2° C. To achieve this, global levels of GHG emissions need to plateau by 2020 and begin a dramatic decline by 2030.
–
–
